Workflow Profiling
You can enable profiling to measure execution timing of your Workflow and identify performance bottlenecks. Profiling traces are compatible with Chrome's built-in tracing tool for visualization.
Example Workflow
The screenshots in this guide use the following workflow as an example; it includes 2x object detection, dynamic cropping, a Google Gemini call, and several visualization steps:
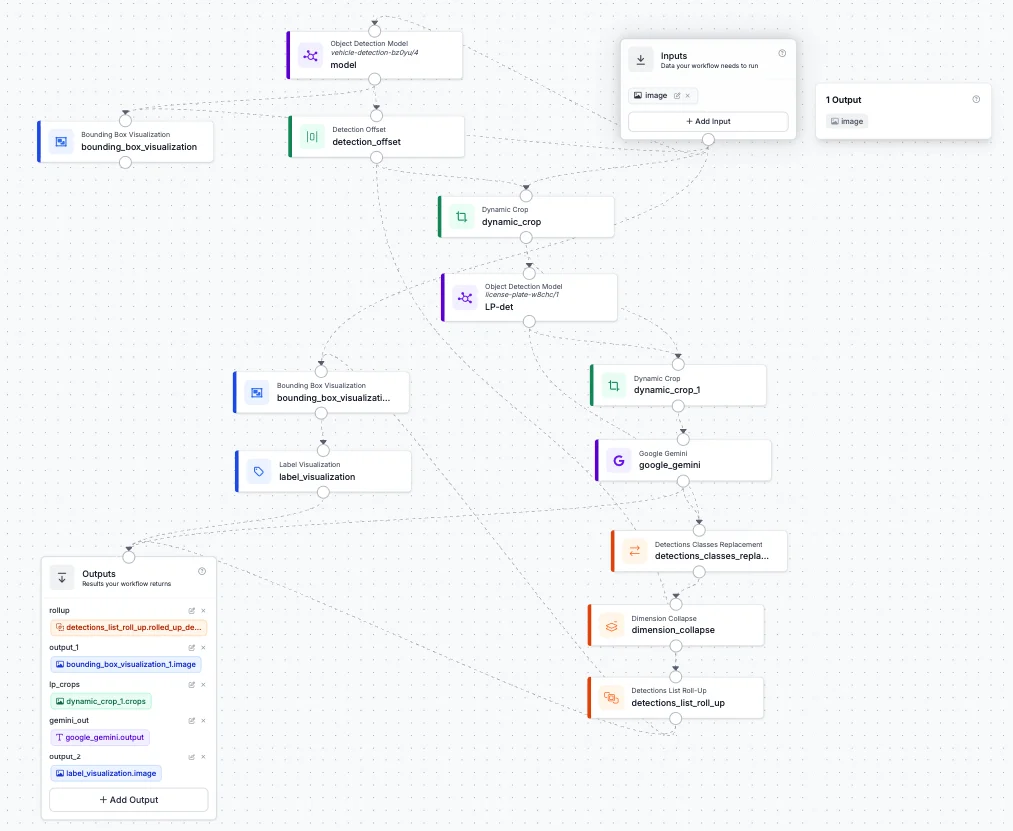
Workflow definition JSON can be found here.
Profiling with the Inference SDK
To enable profiling when running workflows via the HTTP client, you first need to run self-hosted Inference Server with ENABLE_WORKFLOWS_PROFILING=True env variable. Then you can enable profiling when running workflows via the HTTP client by setting enable_profiling=True:
from inference_sdk import InferenceHTTPClient

client = InferenceHTTPClient(
    api_url="http://localhost:9001", # Serverless API does not support profiling
    api_key="API_KEY"
)

result = client.run_workflow(
    workspace_name="workspace-name",
    workflow_id="workflow-id",
    images={"image": "YOUR_IMAGE.jpg"},
    enable_profiling=True
)
When profiling is enabled, trace files are automatically saved to ./inference_profiling/ by default. Each trace file is named workflow_execution_tack_{timestamp}.json.
Profiling with InferencePipeline
For video processing with InferencePipeline you also need to enable workflows profiling with env variable:
export ENABLE_WORKFLOWS_PROFILING=True
Then initialize the pipeline:
from inference import InferencePipeline

pipeline = InferencePipeline.init_with_workflow(
    api_key="API_KEY",
    workspace_name="workspace-name",
    workflow_id="workflow-id",
    video_reference=0,
    on_prediction=my_sink,
    profiling_directory="./my_profiling_output"  # optional, defaults to "./inference_profiling"
)
pipeline.start()
pipeline.join()
You can also control the profiling buffer size (number of frames to keep in memory):
export WORKFLOWS_PROFILER_BUFFER_SIZE=32 # default is 64
Viewing Profiling Traces
Profiling traces are saved in Chrome Tracing Format. To visualize them:
- Open Chrome and navigate to
chrome://tracing/. - Click Load and select your trace file (e.g.,
workflow_execution_tack_2026_03_30_10_46_04.json). - Use the timeline view to inspect execution timing for each workflow step.
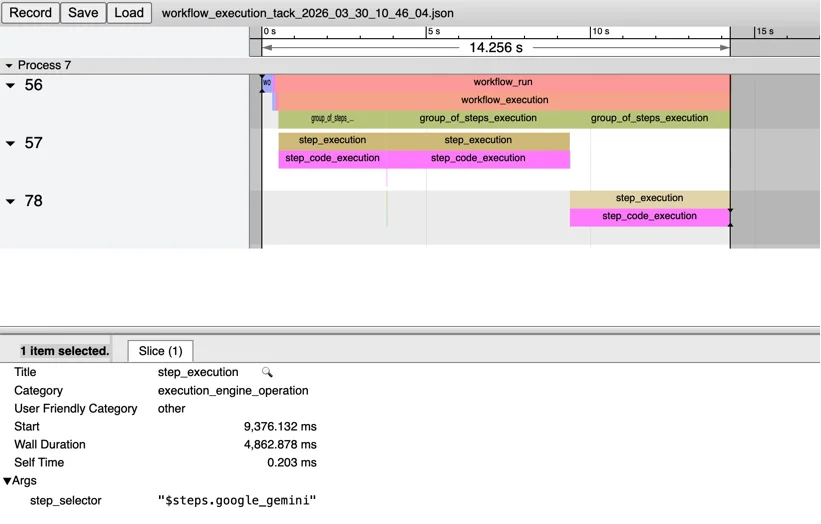
Clicking on any span shows its duration, category, and arguments — such as which block's step_execution you are looking at:
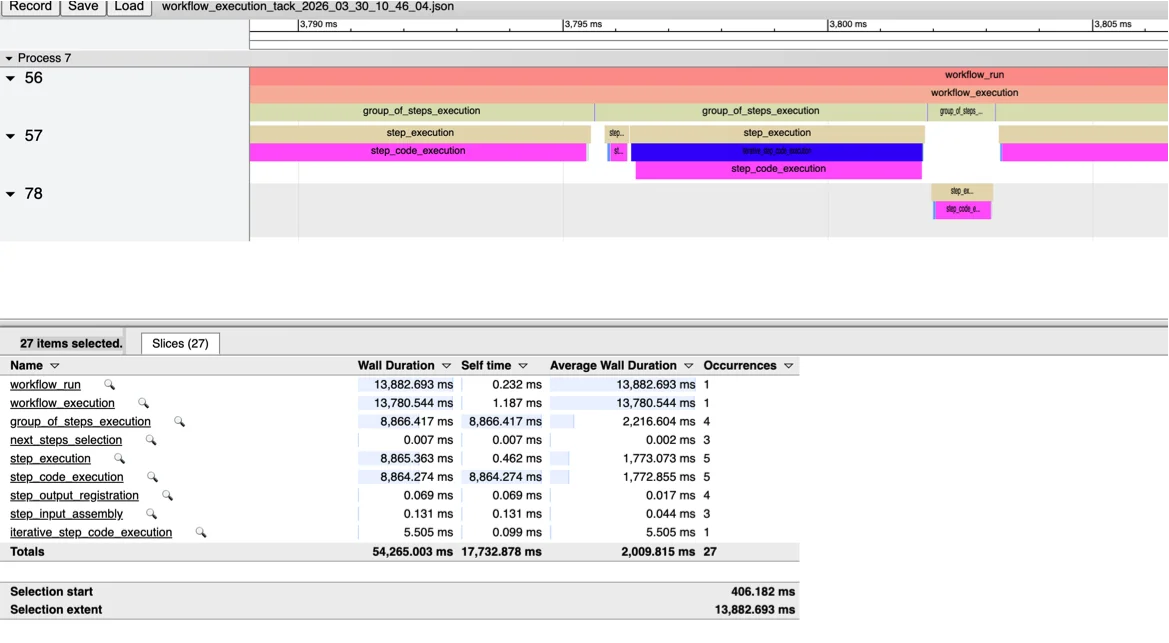
Most of the time was spent on 2x object detection (process 57) and Gemini call (process 78). If you zoom-in, you can see other steps (detection offset, dynamic cropping, visualization, etc.) between the object detection steps:
Key Details
| Detail | Value |
|---|---|
| Trace format | JSON, compatible with Chrome's chrome://tracing/ tool |
| Output location | ./inference_profiling/ by default (configurable) |
| File naming | workflow_execution_tack_{YYYY_MM_DD_HH_MM_SS}.json |
| Buffer size | Number of frames kept in the profiling buffer for InferencePipeline (default: 64) |
Limitations
- Compilation overhead: Workflow compilation adds 10-25ms latency, which is significant for small/fast models where GPU inference time is comparable. This overhead only occurs once at the start for video processing.
- Execution engine latency: The Workflows Execution Engine adds ~1-2ms nominal latency per frame.
- Dynamic blocks: Self-hosted deployments using dynamic blocks may experience +100-140ms latency per request due to pydantic model rebuilding. This is not applicable to the hosted platform or video processing where compilation happens once.
- Model block dominance: Typically ~95% of execution time is spent in model inference itself, which includes additional data transformations and metadata management.
Performance Tips
- Workflow definitions are cached for 15 minutes by default. Use
use_cache=Falseinrun_workflow()to bypass caching if needed. - For video processing, compilation overhead is negligible since it only occurs once at the beginning.
- Profile your workflows to identify whether bottlenecks are in model inference, data transformations, or workflow orchestration.